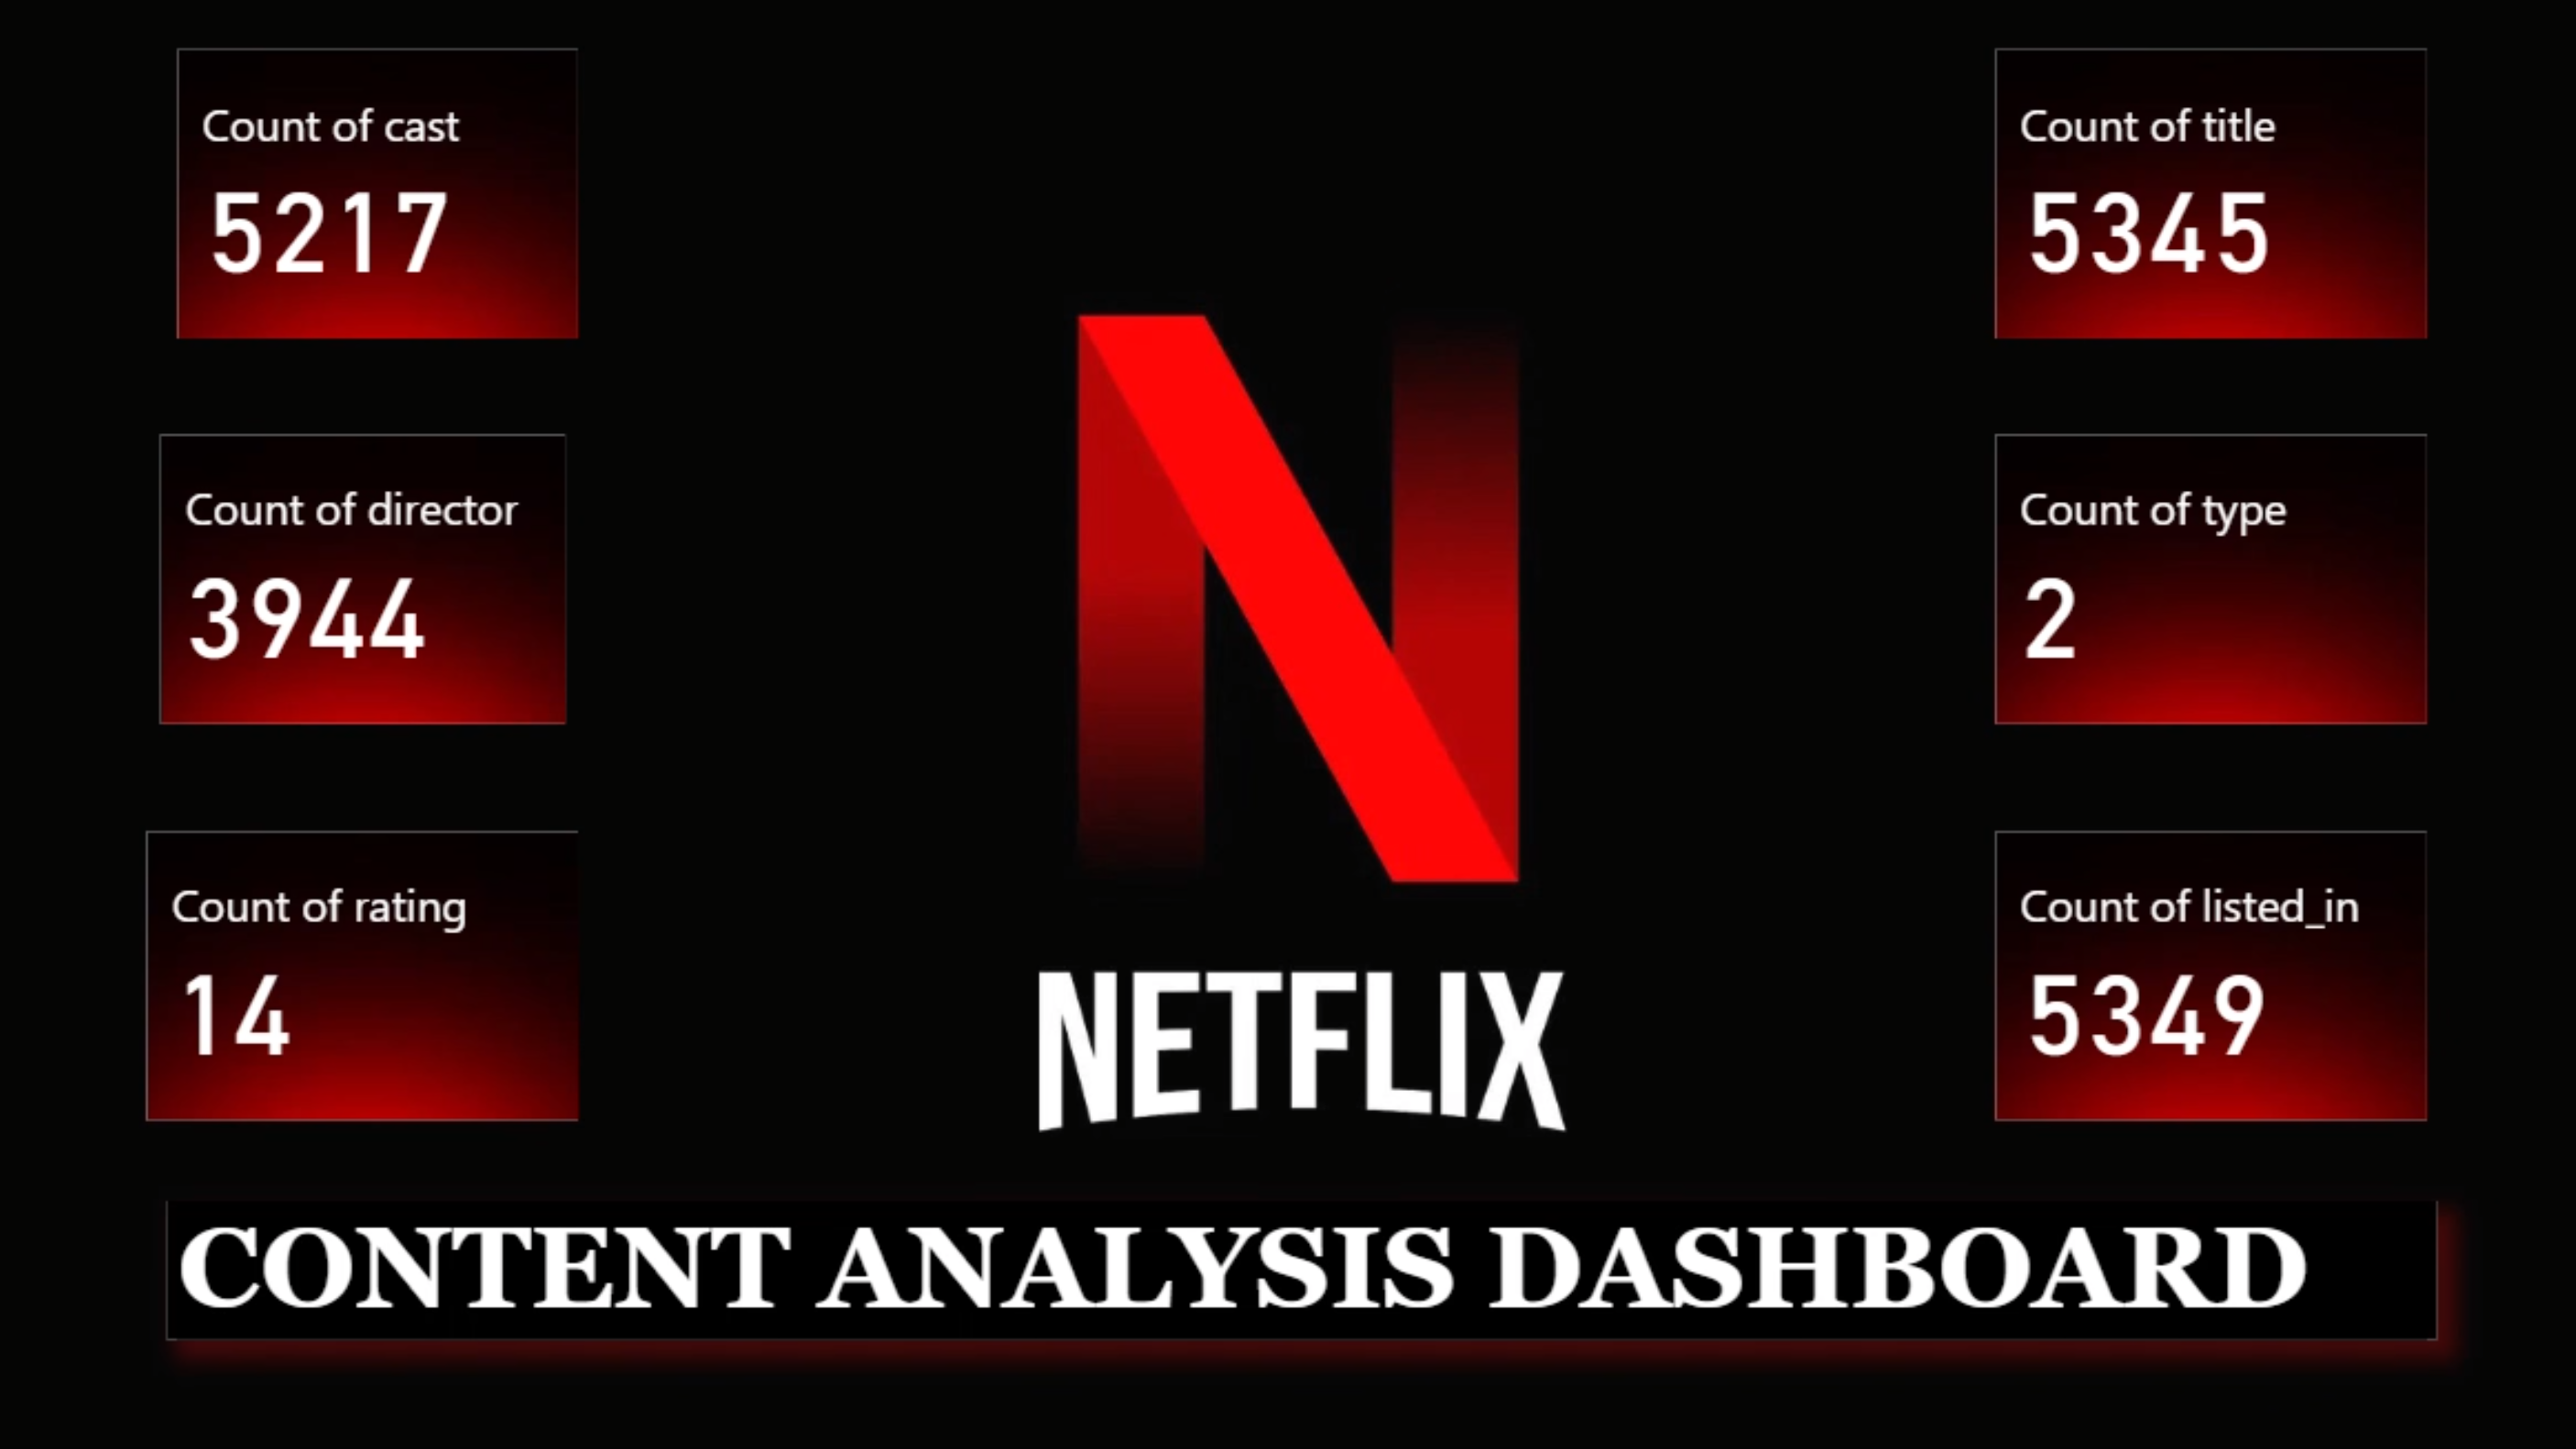
Netflix Content Analysis Dashboard
Project Details
An interactive Power BI dashboard built to analyze Netflix’s global content library, uncovering trends across genres, countries, release timelines, directors, and content ratings. The project focuses on data cleaning, transformation, modeling, and visualization to generate meaningful insights that support content strategy, market expansion analysis, and audience engagement. By transforming raw streaming data into intuitive visual analytics, this dashboard enables stakeholders to explore platform growth, category dominance, and evolving content consumption patterns through dynamic filtering and interactive storytelling.
Skills
Tools
Project Overview:
This project involves designing and developing a fully interactive Power BI dashboard to analyze Netflix’s global content dataset. The dashboard explores multiple dimensions of the platform’s content ecosystem, including geographic distribution, genre composition, rating breakdown, release trends, director contributions, and overall content growth over time. Through visually engaging charts, KPIs, maps, and filters, the project delivers a comprehensive business intelligence solution that enables data-driven storytelling and strategic insights into Netflix’s content strategy and audience behavior.
Problem Identification:
With thousands of titles distributed across multiple genres, regions, and release years, understanding Netflix’s content performance and growth trends becomes increasingly complex. Traditional static reports fail to capture evolving consumption patterns, geographic reach, and category dominance effectively. Decision-makers often struggle to identify regional demand shifts, genre popularity trends, and growth opportunities. This project addresses these challenges by creating a dynamic, interactive dashboard that converts large-scale raw data into structured, interpretable, and actionable insights.
Goals & Process:
The primary goal of this project is to build an end-to-end business intelligence solution that transforms raw Netflix content data into meaningful insights. The process includes data cleaning, transformation, modeling, and feature engineering to prepare a structured dataset for analysis. Power BI is then used to develop dynamic visualizations, KPI metrics, trend analysis charts, geographic maps, and interactive slicers. These components collectively enable users to explore content distribution, growth trajectories, genre dominance, and audience targeting patterns across time and regions.
Project Impact:
The dashboard empowers stakeholders to analyze platform growth, identify emerging content trends, evaluate regional content strategies, and optimize acquisition planning. By enabling interactive exploration of content distribution and performance metrics, the solution supports data-driven decision-making in content development, market expansion, and audience engagement.
